
Week of May 19
- Rishi Pahuja
- May 19, 2025
- 2 min read

Opex was last week. US Credit downgrade after market Friday. The start of Summer this weekend. And, lots of Fed members speaking this week. We'll follow price.

Starting on the weekly chart.. Last week we gapped up hard and closed above last years closing price to get back to green YTD. The path is obviously uncertain but it certainly looks like we'll make new ATHs in Q2.
From a tactical approach it seems we're keeping to last weeks theme. Clearly bullish but in need of a pullback. Tough to long this far extended, tough to short with such strength.

The daily chart is similar. The D200 acted briefly as resistance and once it flipped to support, turned into the jumping off point of the extended rally. We've yet to meaningfully test the ribbon, but with the key psych level of 6000 just above, it could finally be time for a pullback. The 4h chart concurs with the daily with the 8e acting as strong support. Relentless buying the past 4 weeks. Hmmmm, I wonder if that's a coincidence given my excellent 4 week performance. Something very much to keep tabs on - what was the prevailing market direction during different levels of performance?
Hourly SPY
Clear loss of ribbon as support on Friday and last night. The 21e has flipped red and acting as clear resistance. It looks as though we're starting to potentially find support backtesting last weeks bull flag breakout level.

Structurally we've put in a lower low and if we are to continue lower we'd need to develop a lower high, likely closer to the previous high than we'd expect. This is how the market traps. As price retraces to the previous high, more and more participants turn bullish (Price leads sentiment, not the other way around!) and then the rug gets pulled for the continuation down.
Given the strength of the 4h and HTF charts, the breakout retest hold, the hourly could be reversing. We're starting to eat into the ribbon and holding the MD put trigger. If we close above the ribbon, that would trigger a look to enter calls at support / swing low.
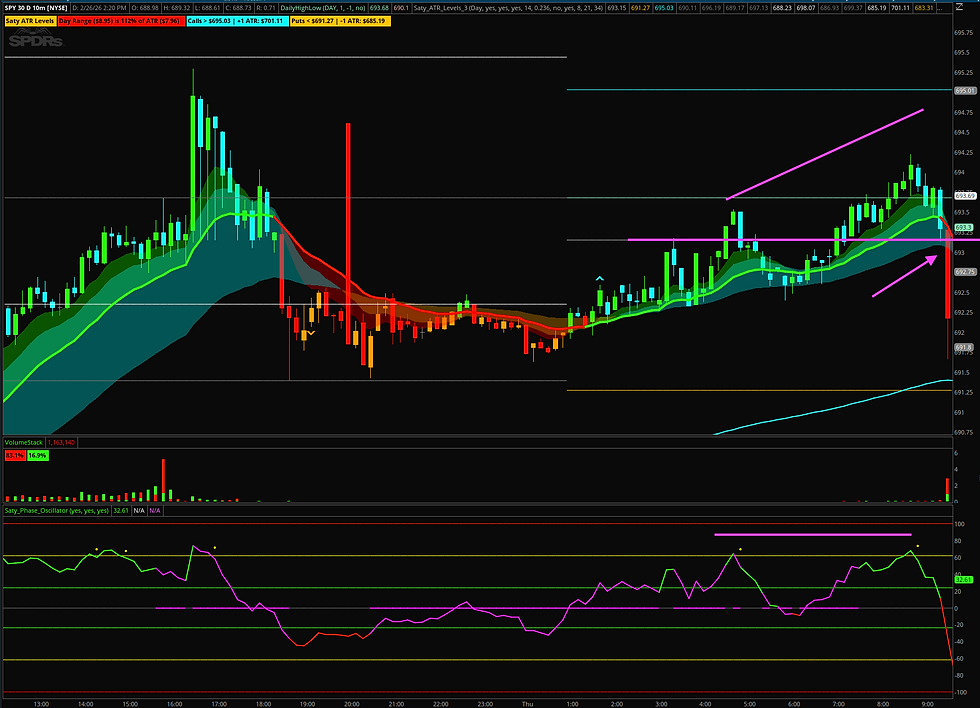
10m Plan
Clear plan. A close below the daily -618 and we trigger a call for puts in the ribbon down to the overnight low, then the daily 786 and -1 ATR. To the upside the 10m ribbon has turned bullish and any dips to the ribbon are buyable with a loss of the 618 as the invalidation level. A close above the previous days low would signal further upside to the -382 level and potentially up to the put trigger.

I don't usually trade Monday mornings because I like to wait for the market to settle and digest the over the weekend news. I will be extra patient this morning, especially because I have to leave the desk at 10:10a. Should be an interesting week!
Comments