
June Recap
- Rishi Pahuja
- Jul 1, 2025
- 4 min read

I wrote about the recent performance streak but wanted to reflect more on the attributes that I believe led to the increased performance. This is to combat my tendency to focus on the negative and serve as a great refresher when I'm finally able to get back to the charts early July.

It's easy to look at the outcome for all the trades and pat myself on the back, but there were plenty of errors I'd like to cut, the most meaningful of which is position sizing.
The trade from June 10... If you notice the return on the overall trade was 11.7% while the impact on the portfolio was 9.6%. Back of the napkin math, position size was essentially full port... That should absolutely never be the case given the max detraction for any trade is 2%. So, unless I really thought I bottomed ticked it there was negative reason to size that large. In the end I justify because in reality it's not my full port and I had withdrawn plenty from the gains from April and May.
My ultimate take away on position size is that 1. it's unnecessary to achieve my long term goals 2. it causes far more impact to the downside than it can offer on the upside. Size will come only after consistently limiting size.
I size systematically. Scale in, then add the rest of the position.
Factors that led to increased performance
Mental flowchart of what actually triggers an invalidation of my directional bias.
Understanding the implications and action plan for ALL potential scenarios
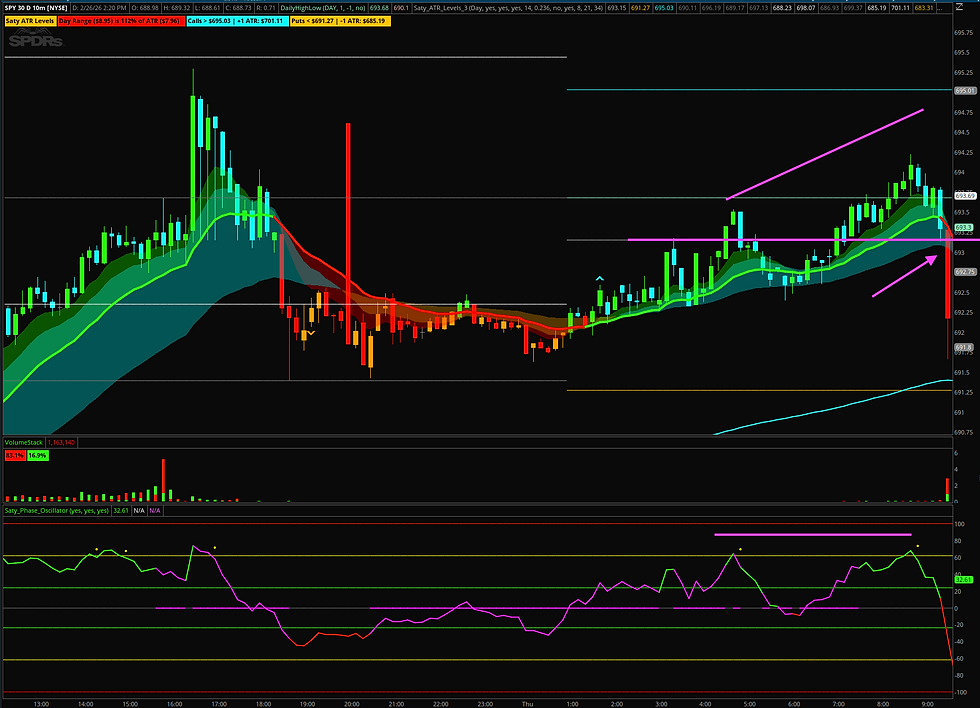
Super wordy but I don't know how else to articulate it. Basically, in June I was very concerned with and clear with knowing what would have to happen for me to be proven wrong. June 10 was a perfect example. All time frames were bullish including the 10m chart. I entered calls in the ribbon. Price absolutely tanked below the ribbon, BUT we never actually closed below the ribbon. We wicked right back up. Because I was supremely aware of the context on HTFs and clear in requiring a 10m close to trigger downside, I was able to remain calm, not panic sell, and instead hold til the trend continued up. Now that I've written it out, maybe a clearer way to title this is process of actually mapping out different scenarios and understanding the implications of each scenario so that when one plays out, I have an action (or non action) plan in place. We always talk about having a plan and executing the plan. But, the plan has to account for every possible outcome.
It's not enough to know how I will act when price reacts to a level, but also how I will act if it then plays out completely different that what I expect - expect the unexpected!
Extreme Patience on the 10m chart
When I review the chart after the close, I can spot very quickly where I could've / should've / would've entered based on the system. Another way of expressing this, is that, it always become obvious. In looking back on my years of trading, a common theme is that I end up taking suboptimal trades, only to be deprived of confidence and capital by the time the optimal or obvious trade emerges. It could be that once I'm unable to trade, then it becomes obvious but my extreme patience this month and the resulting performance prove otherwise. It's actually just that it does become obvious. I need to trust that. And, wait for it.
If I've waited long enough for an 'obvious' setup to appear on the 10m chart, then additional patience is required to enter at the loss minimizing level.
Setup Identification vs. Entry Identification
This past month I was incredibly aware of 1. waiting for a defensible setup then 2. waiting for the right area to enter, no matter how much fomo is created on a move in my expected direction. It always comes back. Not only does it come back, but when price is at the desired entry again, I 3. zoom into the LTF waiting for a reversal candlestick pattern (ideally with divergence!).
By identifying the 10m setup, waiting for the level (Caspar), then identifying a proper reversal pattern on the lowest time frame, I'm optimizing for a trade I can hold rather than scalping the low time frame.
Where I get into trouble is finding a setup on the LTF - which is fine - but then expecting it to continue and not securing profit - very not fine.
The timeframe of the actual setup dictates the potential move. Especially when trading 1dte, there's no reason to exit too quickly.
So, great June. Now can I do it again? I cannot control the outcomes of my trades, but I can control the quality of the trades I enter. So the goal in July is not more money or higher win rate. It's being proud of each trade entry, having a clear defensible reason for each trade, scaling in do to low time frame triggers, and waiting to exit based on the PA only. I can do this. I have done this. I will continue to do this.
This week. Next week. July. August. September. Q3. Consistent, quality, each and every day, compounds.
blablabla
Zoom in at entry level, wait for reversal candlestick pattern on LTF - ideally with divergence.
Comments