
August 4
- Rishi Pahuja
- Aug 4, 2025
- 4 min read

THIS WEEK...
I don't know what to say, other than I've been here before and have negated it before with over confidence. I will stay humble. I will focus on my process. I will wait until obvious. I will stay patient. I will scale in slowly as I'm always early. And, add as conviction grows. Or, cut because losses happen and the only thing that can derail me are large losses.
My mindset was my super power this week. I was resilient. I accepted the losses. I waited until a defensible and well articulated setup presented itself, and then waited until the right caspar entry.
Weekly I rarely go to the weekly as it's pretty irrelevant to my trading but it does feel like we could be in a transition of sorts. Last week we put in a bearish engulfing candle with support at the weekly 8e. Pretty meaningful volume as well. Last week also triggered a mean reversion on the PO with RAF confirming with an arrow down as well. So, we're on the lookout for a move in time or price to the 21e. Currently the 21e is at 6032. This is the weekly chart so it could take the whole month. If we are indeed headed down or sideways, last weeks range extremes will be very important levels. I could see us slowly drifting higher and ultimately rejecting the PWH given the higher probability of downside or sideways. 6520 is the +1ATR level for EOY.
Daily
Bullish structure. Last Friday we gapped down hard below the 21e only to hold at the previous quarter close. Which was it's third time holding as support. 7/7 and 7/16 were the previous instances. At 120pm today it looks like we're going to close the weekly gap down. I'll then wait to see what happens from there. But, as PO suggested we have completed the mean reversion and we're no squeezing on the daily. Key level above is 6340ish, also the quarterly call trigger. We're bullish but have levels above now.
4hour
Bearish ribbon. Became extended. Two dot mean reversion signal. Just achieved the mean reversion 20 minutes ago. We're currently at a very significant level... Quarterly call trigger. 70% retracement is right around the previous swing low. Expect price to chop around here before making a direction. Supply zone for the deep selloff Thursday/Friday is just above. On SPX it's an equally important level. Previous monthly close, the 4h 21e. But, the ribbon is still clearly bullish with the previous supports holding.
Hourly
21e turned green. Pulled back premarket and rocketed off the 21e to break the call trigger and tap the 382. Tapping the 382 signals a likely move higher by EOW. But, we're currently made it to the distribution zone on PO and at the previous supply zone. SPX hourly is still negative with the 48e just above. And, the 500 just above that.
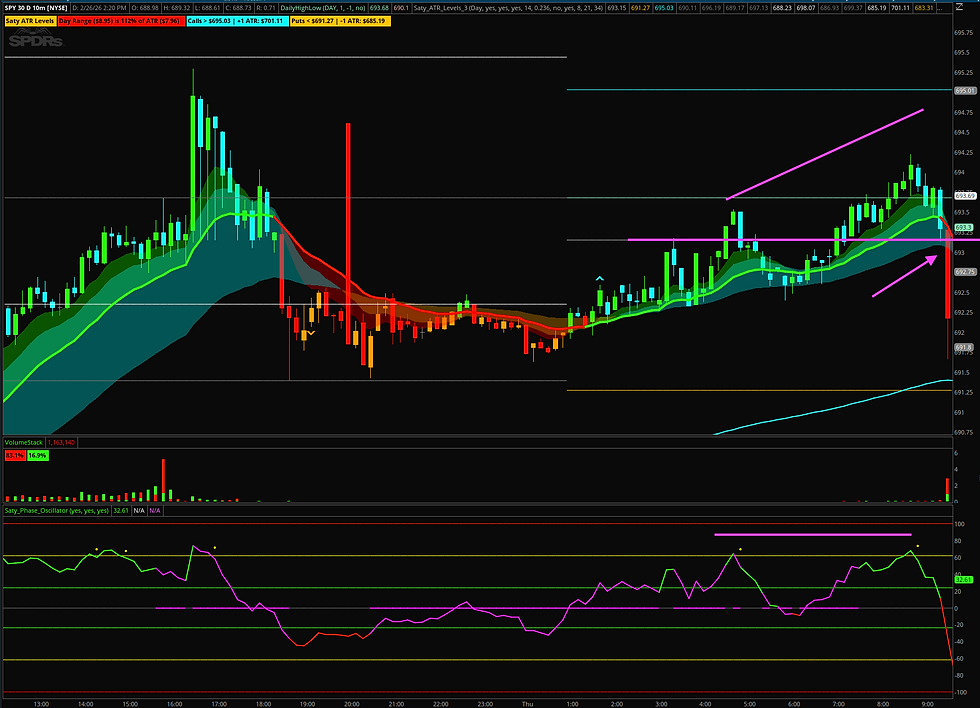
10m
Extremely bullish ribbon, period. Dips to the 8-13 zone continue to get bought up. Yes, we are continuing to rise with lower and lower PO values. And, lots of mean reversion dots. And, divergence on VIX starting to form. All of this has my biased to downside from here only. But, the 10m trend is incredibly in tact. The +1.618 is just above. Momentum is stalling and SPX 200e is trying to act as resistance. We may have just formed a tweezer top. BUT, the ribbon continued to act as support. I will defer to the ribbon or wait for an 'obvious' rejection of HOD.
The trend is very clearly up and we have moved a great deal. That doesn't mean take puts. It does mean don't take calls until we react to clear support and a retracement of HOD.
Okay, we got both. First a swift rejection down to the 10m 21e. And, then a bounce off the 21e 2x. It was mostly chop besides the swift rejection but I was in position and capitalized.
Most importantly I scaled in slowly. I resisted the temptation to oversize my adds. Instead scaling in slowly. I had a clear thesis as to where price should go as seen by the dotted line in the horizontal channel.

We were rounding again, this time with divergence. The ribbon continued to hold but we were at a significant level on higher time frames. The tweezer top was an extra early entry. Waiting the next10m candle gave a little more confirmation that down was likely given that resistance held. But, it was the 3m chart that gave the clearest entry.
After the tweezer top on the 10m, the 3m showed an inability to break the HOD despite the 3m21e holding. The 3m tweezer top was the first indication to enter. Then after we looked below the 21e that signaled more downside. We officially lost the 21e on a closing basis. The pullback to the 21e was the perfect entry before the explosive move down.
This was a stress free trade. Well thought out. Well justified. My only 'error' buying ITM cons. I wasn't aware I was doing it but it did allow for a meaningful dollar move despite such a small move in the underlying.
Because of how explosive the move was my first exits were actually the best. Done for the day. Zero reason to continue trading...
Famous last words. Of course, I got married to my bias that we would continue further down. Or that we would have to W off the 10m21e so we need a trap move up before heading down at least to the previous low. BUT everything was point up. The 10m21e did act as support and was an amazing entry for calls.
The better play was to wait for the move I took down to the ribbon, then entered calls given the 10m21e held and it coincided with previous support (which was my take profit level on the puts!).
Unexpected huge day on that first trade. Just no reason to continue trading. I put very little money at risk and returned 47% on my max exit. Easy because size was small! Justification was there.
I will repeat today.

Comments