
August 29
- Rishi Pahuja
- Aug 29, 2025
- 3 min read

Wait until a stupid obvious setup on the 10m
Identify CaSPar
Check if premium is squeezing with divergence
Where is the stop loss? Why? What % of the port are you willing to risk?
Scale in
Hourly Bias
10m PA - What has happened? What just happened? Last 10m S/R
10m Swing Pivots SPY and SPX
10m Setup? If up where has support been? If down where has resistance been?
Strike Selection = next day level
Where is premium support?
Is there a squeeze? Is there divergence?
3m PIVOTS for Entry / Stop Loss //
Manage in terms of stop loss
Stupid Obvious!
Daily - Quarterly ATR
Stupid bullish. Mean reversion morning star. Pullback to the ribbon, now breaching previous ATHs through the 500 level. Next up is the 618 level. However, I wouldn't enter calls here, I'd wait to see how price reacts to the ribbon. 382 and ribbon held before. Look for it to hold again there.
4h - Monthly ATR
SPX chart is very similar to the daily. Deep bull flag into the 4h 48 / Previous Month Close. Ripped through the ribbon, pulled back to the 8e and call trigger and now we're off. 6518 is the 500 level and next level up. This is the last day of the month so not a terrible target. Though wouldn't get long here. I'd have to wait for the ribbon. Spy is showing a little bit of weakness on the 4h. We continue to make HHs with slightly lower PO levels. RAF has fired down but the 21e and 382 remain just below as firm potential support.
H - Weekly ATR
SPX has actually just been stuck within the weekly trigger box. MD put was support. MD call showing resistance. But trend is very firmly up and all dips have been bought. We are at call trigger resistance and PO has not exceeded the previous peak. This does not mean we definitely reverse here, but is something to keep an eye on.
SPY Hourly is a bit more bearish. Structure is still bullish but we've lost the 21e. Previous week high and the H48 are acting as support. But we now have a downward sloping 21e with the 8e having crossed below. If yesterdays high was a local top, and if this morning low is a local low, the fib pullback before more downside consideration is higher. So, either I consider long down at the premarket low or I consider short in the overnight supply zone.

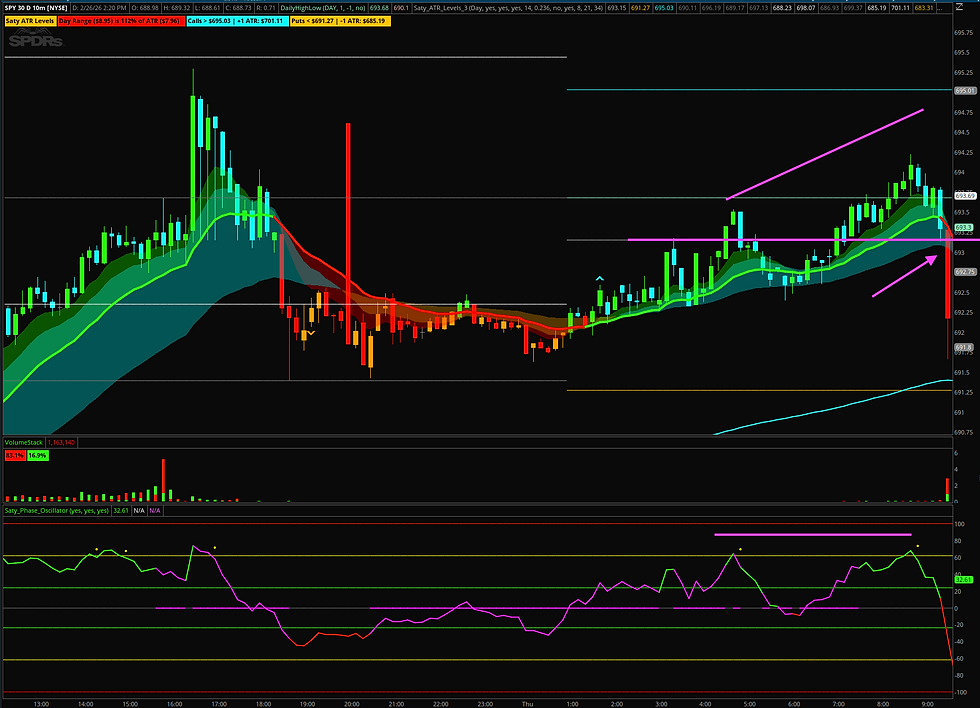
10m - Daily ATR
The supply zone coincides with PDC and PDH. We very firmly found support at PMH and the -382. We do look like we're trying to ivom, but it's tough to get long here without first seeing the 10m 8e, 21e, 48e, continue to hold as support, especially given the put trigger and H21 are just ahead. The overall bias is long, but on the hourly it's getting hard to decipher in the immediate term. The last 6 10m candles... Support at the 10m 8e, resistance at the put trigger.
10m Plan
The 10m ribbon is very clearly down. We're at put trigger resistance, the H21, the 10m 200. If we lose the 21e or 382 we could see more downside. The 618 has a strong probability to hit. If we do ivom then PDC is the next level up.
6500c OR 6470P

NEWS AT 945 AND 10
Wait until so obvious on the 10m!
Feels like up but so much resistance here. And, not necessarily at support. Certainly not support that was previously resistance. Or, are we... Just because we're at support doesn't mean we have a setup. Except the ivom. Thinking long.
Perfect plan. Premarket low broke and we proceeded to sell. I kept trying to catch the reversal but momentum was way too high. PO is meaningless when momentum is this strong.
WHAT IS THE JUSTIFICATION / SETUP / PATTERN ON THE 10M FOR ENTERING
Hourly Bias sideways
10m Bias down
What was the explanation for getting long?
What's the explanation for getting short?
It's imperative to wait for a concrete and justifiable setup on the 10m
Comments