
9.29
- Rishi Pahuja
- Sep 29, 2025
- 2 min read

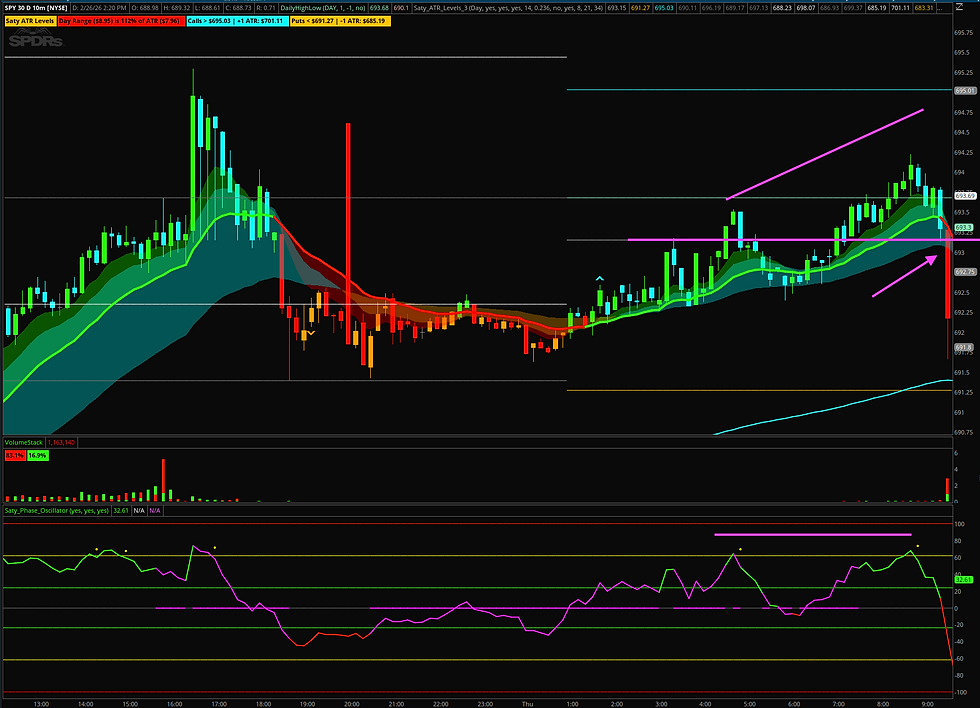
10m SPY was down. Just a matter of waiting until a move into the ribbon to trap late longs and then continue the move down.

Because we were trending down. Here's the confluence I'm looking for to consider puts:
Visual plan that shows continuation entry's occur inside the ribbon, creating a lower high / swing high, pushing to make a lower low / swing low at the next ATR level down.
A probabilistic view on the next ATR level to hit and why
3+ candles unable to break an EMA or ATR level
oorr resistance to be created at or around a previous support level
a TL moving up and to the right that is acting as support
the 3/21 to be red or turn red
early indication is the 1/21 turning red and creating a TL for the previous highs to act as the ultimate stop loss
A 50% to 80% retracement of the previous swing high
Price moves in waves, for downside I want to enter as the wave starts to topple
We started to lose the call trigger. I figured we would likely bounce off the previous day high. But I didn't want to take the counter trend play back up given the trend was down. Instead the play was to wait, wait, wait for price to react for 3+ candles inside the ribbon.
I entered after the second rejection of the call trigger. But, price was starting to create HLs and HHs. I needed to wait longer. However, I sized for a full loss so I was able to stomach the drawdown.

We spent 40 minutes trying to breach the 10m34e and the previous swing low. By that point we had retraced 85% of the move, but unable to close above the 78.6% retracement.
So,
We were back in the ribbon which is a higher probability entry for continuation
Continuation would likely send us down to PDH minimum and then PDC
4+ candles, while yes holding the 10m21e, unable to break previous supply/resistance/swing high
a retracement that couldn't close more than 78.6%
Clear trend line moving up from the low at PDH
once the 1m21e turned red I created a TL connecting the highs which failed to breach
3m21 flipped red and started the rapid decline down
The simplest way to think about it...
The 10m21e was clearly down. Wait for price to enter the 10m ribbon. Once the 3m21e is lost enter puts, using the candle high as the stop loss or additional entry point.
10m21e was red. Need 3m21e to also be red or turning red (via 1m21e turn).

Given the incredible drawdown I simply took profit once I had it. However, if I held until PDH actually hit again, return would've been closer to 100%. Then waiting until PDC actually hit, which was the original profit target, 180%+. And, my drawdown to PDC sell 1000%.
While profit is profit, I do need to get better at waiting until my actual targets are hit. I just need to defer to the plan.
I'm getting there.
Comments