
10.8 Morning Plan
- Rishi Pahuja
- Oct 8, 2025
- 2 min read

Daily... still bullish AF. Tho we put in a bearish engulfing yesterday with the Daily 8e holding as support. Bias is up but would not be surprised to see some sideways action in the short term to digest this most recent run.
4h.. also bullish though weakening and turning more sideways. The HH we put in yesterday was with PO divergence. We breached the 21e, the 48e acting as support. We're still a bit far from the supply zone created by yesterdays flush. So, I'd like to see a LH created before considering a larger move down.
Hourly... MD call trigger was clear resistance yesterday. A flush down with Septembers high acting as support and a reclaim of PWC. The distance from yesterdays flush is magnified on the hourly chart. No ribbon thickness. Pretty clear pennant forming. Waiting until either side breaks and holds would be the indication of direction going forward. All reversals start as a bear flag and the HTFs are up.. but, a bear flag can also just be a bear flag. Patience.
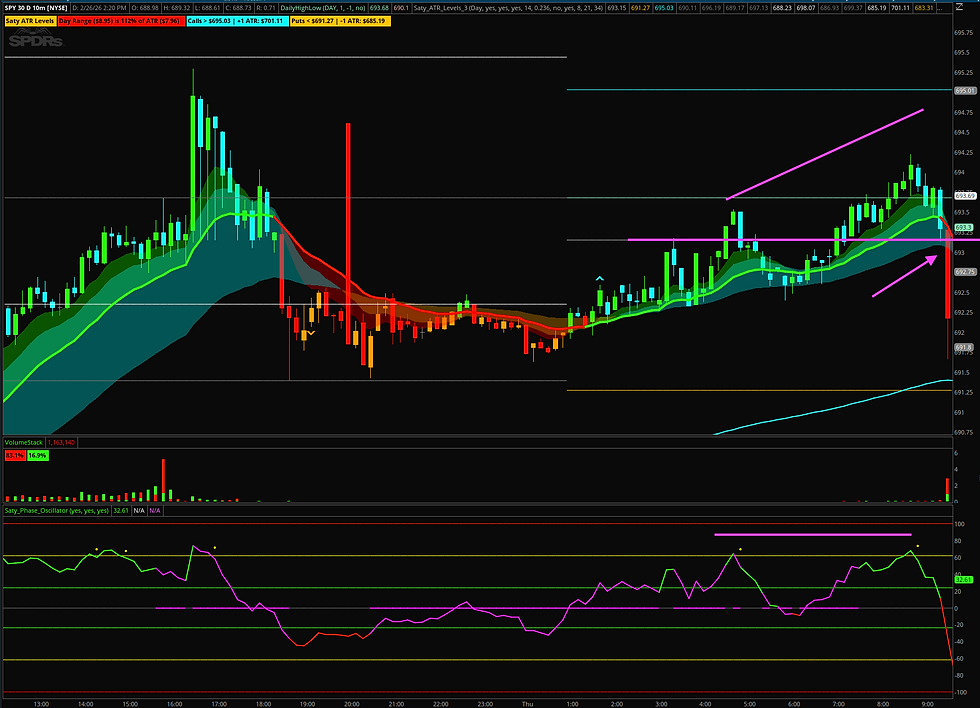
10m... bear flaggy, tightening, Loss and hold of PDC signals a move down to the put trigger. Break and hold of the call trigger / premarket high marks a move to the 382/500/618. Bias is up given the distance from yesterdays supply zone and HTF bullishness.

9:20a rejected premarket supply again, but call trigger held.
9:30a large dip down to TL support with a close that held 10m48e and 670
9:40a deeper dip and higher peak closing as a bullish engulfing
That's the signal to get more active for a call entry
9:50 - 10 3m chart showed clear support at 670

9:50 candle closes just above the call trigger and again holds the 10m21e

Entered 30 delta calls at $4.6 with a close below 670/call trigger as the stop loss.
First exit at the 382 at $7.6 - 65%
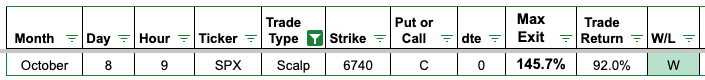
Last exit at SPX scalp +1 ATR / 6740 at $11.3 - 145%

Reverse Checklist.
Daily snapshot + bias
4 hour snapshot with structure + bias
Hourly snapshot: ATR levels, structure, SZ, DZ, retracement in line with structure = bias
"trade" the hourly chart with 7dte
10m range or trend? ATR levels, structure, TLs
10m visual plan with strike selection
What happened relative to plan and bias?
10m candle confirmation for entry?
Since up where is support? Where is stop loss?
Premium swing low support? ivommy? 30-40 delta.
SMALL SIZE, PERIOD.
Mark stop loss
Mark entry level and time
Mark ATR level TP
Mark ATR level Runner Target w. technical stop of 3m21e
Ignore premium chart, defer to underlying PA
How many points have we moved? How much time has elapsed?
Dips to 3m are for late adds
If I can go through these steps consistently and without wanting to make a trade or without fearing a loss, I will be profitable.
I keep from 'wanting' to take a trade by deferring to the visual plan and knowing there's no such thing as missing a trade.
I keep from fearing a loss by sizing appropriately and scaling in.
This is how I win.
Boringly and slowly execute these items methodically.

Comments